New App Features in VictronConnect and VRM
Date Posted:12 September 2022
Victron Energy has introduced three exciting new features to the VictronConnect App and Victron Remote Management (VRM) to provide you with more information.
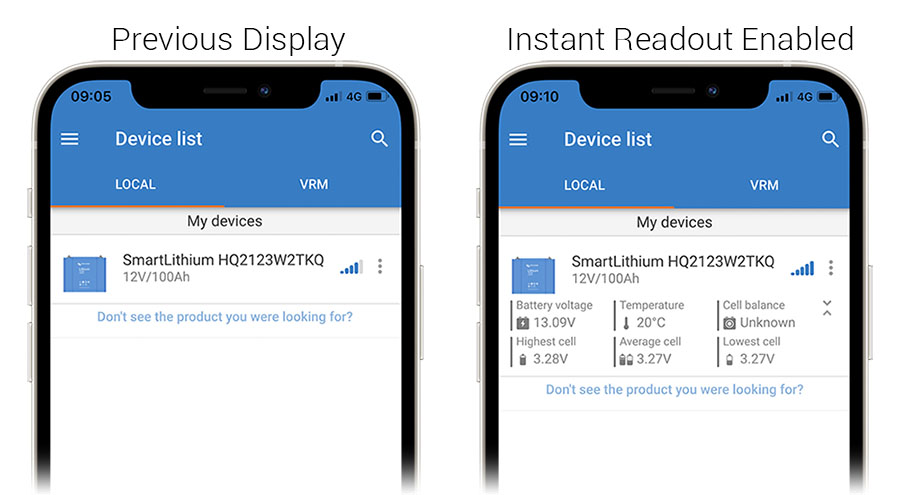
NEW: Instant Readout – all essential front-page data on VictronConnect
The Instant readout feature presents essential live-status information from a Bluetooth-equipped device as soon as it’s detected – you won’t even have to connect to the device!
Normally, in the device list you only see the device type and Bluetooth signal strength. Once enabled, you won't need to log in to the device to view relevant information.
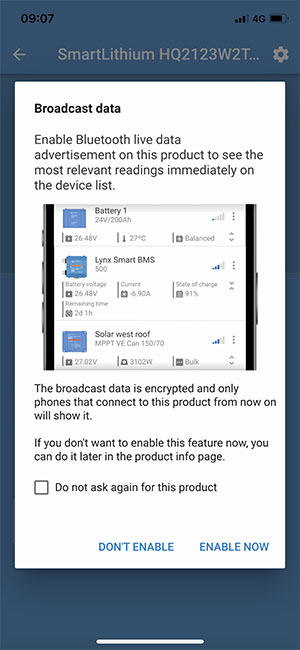
You may need to update both the VictronConenct App and the Firmware on your devices. Once done when you go to log in to a device that has Instant Data then you should be presented with the following option:
The Instant readout box is expandable (as shown above) or it can be collapsed to show only the first line of data for the device.
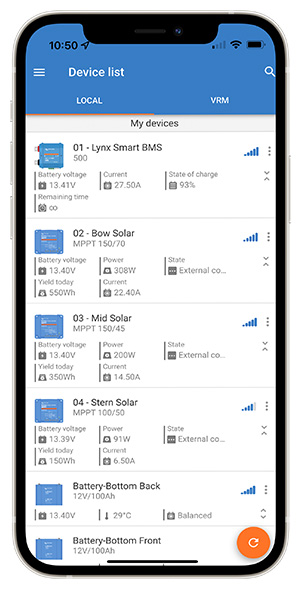
A fully populated device list with Instant readout enabled might look like this:
Another useful feature of this upgrade is the extended Bluetooth range. Because Instant readout is received only – rather than a two-way communication – the range at which the Bluetooth signal can be received by your phone or laptop is extended.
NEW: System Status Widgets for VRM app
For VRM users, you're no doubt familiar with logging onto VRM from where you can manage and browse the extensive information for all the devices in your power installation – wherever you are in the world. The new Widgets allow you to see the most important data, instantly, anytime, anywhere. And you don’t have to do anything!
Widgets – instant access to your system’s headline data.
Widgets present the latest installation data: State of Charge; Load; Solar harvest; and Grid power.
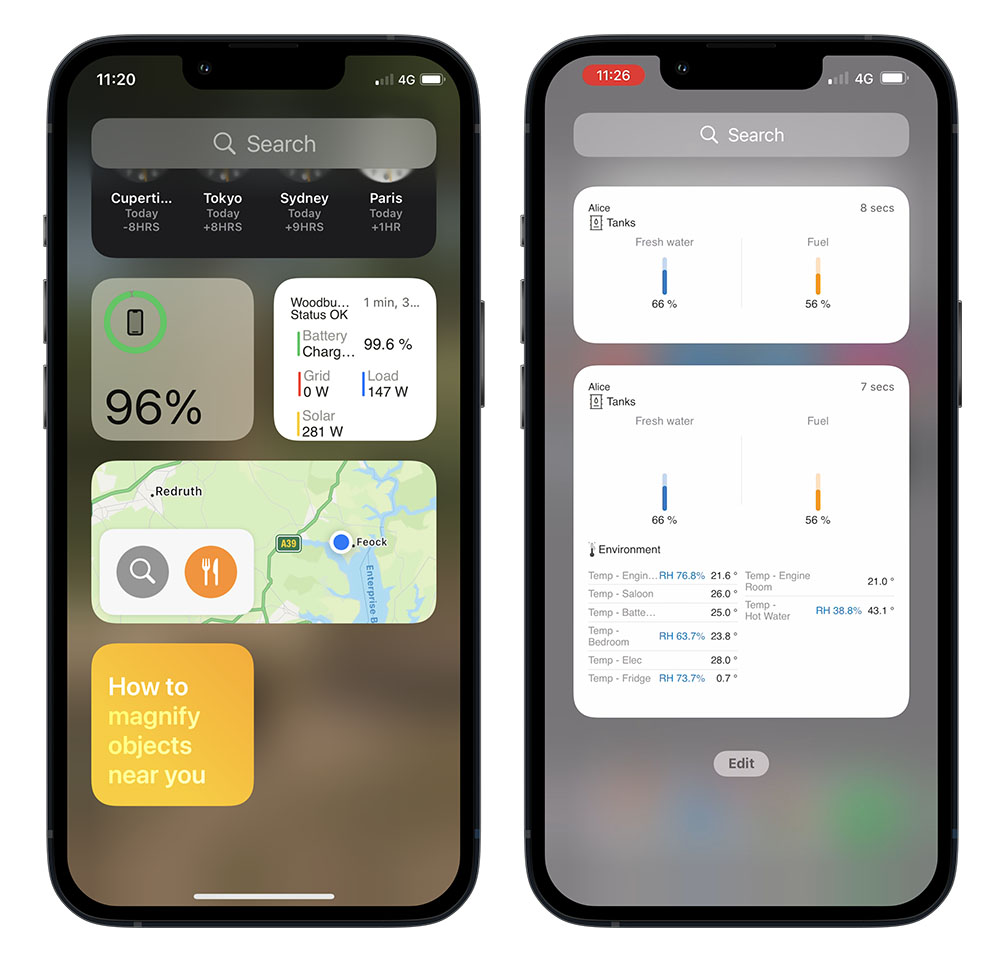
You can also choose a widget to provide Tank-Level, Temperature, and ambient Climate Information related to your system …or to keep track of the charging progress for your Electric Vehicle. Always on – the widget window can be tethered to the Home Page, ‘Today View’ or other frequently used locations on your phone or computer.
It shows up-to-the-minute headline data whenever you navigate to it. There’s no logging in. It’s an on-screen dashboard allowing you to glance at your system status whenever you choose. For more detailed information at any time, tapping on the widget will take you straight to the VRM web portal.
To install VRM app Widgets follow the instructions in the VRM App Widget manual.
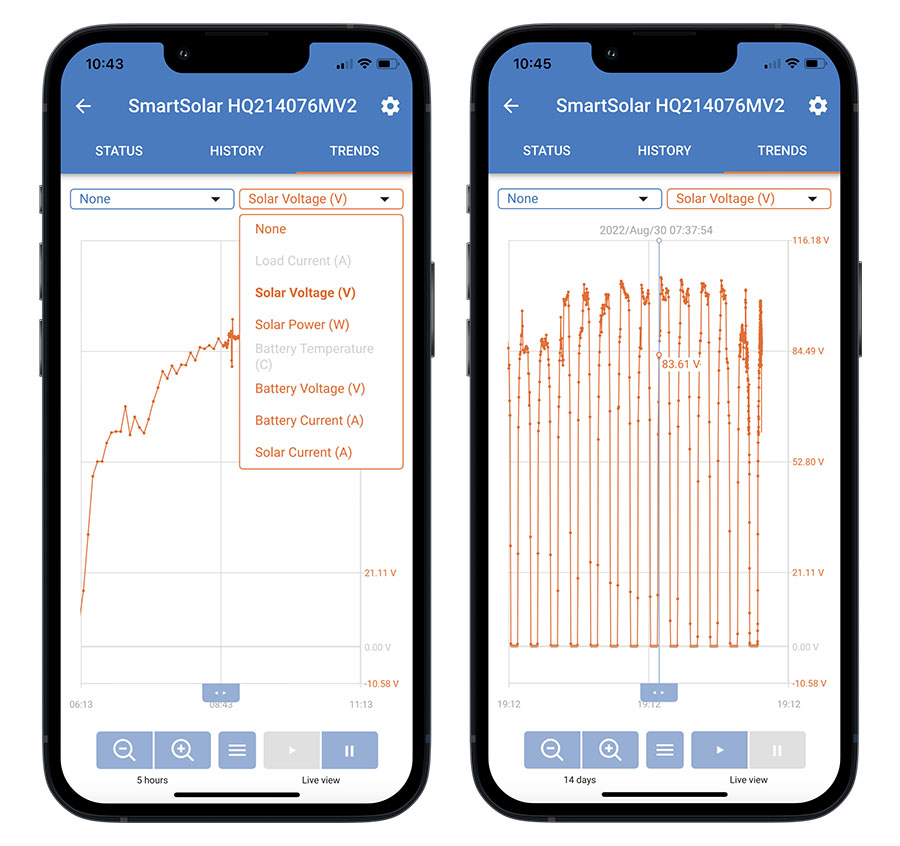
NEW: Stored Trends
You’ve probably discovered the Trends feature in VictronConnect which is available for devices such as Battery Monitors and Solar Charge Controllers. It offers a graphic presentation of real-time data and allows you to observe and compare the interaction between two data sources. The data flow can also be paused for more considered analysis.
What’s new is Victron have recently added Trend data storage – allowing you to observe the graph history over the past 45 days – or as long as six months in the case of the Smart Battery Sense.
The observation period can be chosen by using the magnifying tool. The minus button takes you back through time, and the plus button advances.
This powerful record allows you to observe the performance of your installation before and after some significant change – adding a new device, perhaps – or seasonal changes; changing from lead to lithium; increasing charging ability, battery capacity …or load.
The period of observation available is from between 15 seconds to 45 days (180 days for Smart Battery Sense). Between those two extremes, there are twenty incremental steps. At the maximum history span, the recorded observation interval is 30 minutes.
Stored Trend trace lines are dotted at the moment of data collection – live data has a clear trace.
Analysis of the actual performance over a period of time allows you to make informed decisions for the future management of your system.
New Features in VictronConnect & VRM App, Widgets, Stored Trends & Instant Readout - Video